Key figures at a glance
| XLS Download |
|
|
2012 |
2013 restated |
2014 |
||||
|
||||||||
Income statement |
|
|
|
|
||||
Premiums written |
EUR millions |
9,646.03 |
9,218.57 |
9,145.73 |
||||
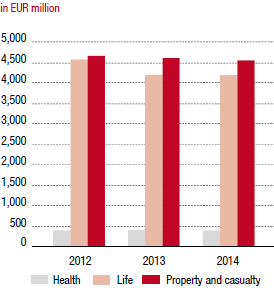
Property and casualty insurance |
EUR millions |
4,673.44 |
4,618.38 |
4,560.39 |
||||
Life insurance |
EUR millions |
4,581.08 |
4,202.37 |
4,199.04 |
||||
Health insurance |
EUR millions |
391.51 |
397.82 |
386.30 |
||||
Premiums written |
EUR millions |
9,646.03 |
9,218.57 |
9,145.73 |
||||
Austria |
EUR millions |
4,122.53 |
4,073.88 |
4,076.99 |
||||
Czech Republic |
EUR millions |
1,795.58 |
1,762.08 |
1,683.41 |
||||
Slovakia |
EUR millions |
704.11 |
744.67 |
726.99 |
||||
Poland |
EUR millions |
1,611.74 |
1,142.30 |
1,034.05 |
||||
Romania |
EUR millions |
408.61 |
361.80 |
339.67 |
||||
Remaining Markets |
EUR millions |
975.56 |
1,061.64 |
1,155.64 |
||||
Central Functions |
EUR millions |
1,341.44 |
1,303.85 |
1,289.84 |
||||
Consolidation |
EUR millions |
-1,313.53 |
-1,231.64 |
-1,160.86 |
||||
Results from investments |
EUR millions |
1,242.33 |
1,226.85 |
1,116.86 |
||||
Profit before taxes |
EUR millions |
563.70 |
355.15 |
518.37 |
||||
Property and casualty insurance |
EUR millions |
330.93 |
53.58 |
309.64 |
||||
Life insurance |
EUR millions |
201.37 |
266.00 |
161.57 |
||||
Health insurance |
EUR millions |
31.40 |
35.57 |
47.16 |
||||
Profit before taxes |
EUR millions |
563.70 |
355.15 |
518.37 |
||||
Austria |
EUR millions |
295.98 |
235.09 |
169.73 |
||||
Czech Republic |
EUR millions |
194.97 |
197.82 |
177.87 |
||||
Slovakia |
EUR millions |
56.89 |
55.26 |
59.46 |
||||
Poland |
EUR millions |
41.57 |
50.22 |
55.16 |
||||
Romania |
EUR millions |
-44.86 |
-98.70 |
6.08 |
||||
Remaining Markets |
EUR millions |
39.13 |
49.00 |
51.66 |
||||
Central Functions |
EUR millions |
-20.08 |
-133.31 |
-2.24 |
||||
Consolidation |
EUR millions |
0.10 |
-0.23 |
0.67 |
||||
Profit for the period after taxes and non-controlling interest |
EUR millions |
425.52 |
234.33 |
366.80 |
||||
|
|
|
|
|
||||
Balance sheet |
|
|
|
|
||||
Investments* |
EUR millions |
35,906.59 |
35,800.89 |
38,101.72 |
||||
Shareholders’ equity |
EUR millions |
5,688.61 |
4,966.55 |
5,283.43 |
||||
Underwriting provisions |
EUR millions |
32,021.77 |
32,469.83 |
35,282.37 |
||||
Total assets |
EUR millions |
42,310.80 |
41,938.62 |
44,425.09 |
||||
|
|
|
|
|
||||
Share |
|
|
|
|
||||
Number of shares |
Units |
128,000,000 |
128,000,000 |
128,000,000 |
||||
Market capitalisation |
EUR millions |
5,168.00 |
4,636.80 |
4,746.24 |
||||
Average number of shares traded by day |
Units |
rd. 76,000 |
rd. 64,000 |
rd. 65,000 |
||||
Year-end price |
EUR |
40.375 |
36.225 |
37.080 |
||||
High |
EUR |
40.375 |
42.810 |
40.070 |
||||
Low |
EUR |
27.630 |
34.260 |
33.800 |
||||
Share performance for the year (excluding dividends) |
% |
31.86 |
-10.28 |
2.36 |
||||
Dividend per share |
EUR |
1.20 |
1.30 |
1.40** |
||||
Dividend yield |
% |
2.97 |
3.59 |
3.78 |
||||
Earnings per share |
EUR |
3.01 |
1.57 |
2.75 |
||||
Price-earnings ratio as of 31 December |
|
13.41 |
23.08 |
13.48 |
||||
|
|
|
|
|
||||
Number of employees (average for the year) |
|
24,086 |
23,362 |
23,360 |
||||
thereof Austria |
|
5,405 |
5,235 |
5,202 |
||||
thereof outside Austria |
|
17,961 |
17,584 |
17,725 |
||||
thereof central functions |
|
720 |
543 |
433 |
||||
Premium development by lines of business
|
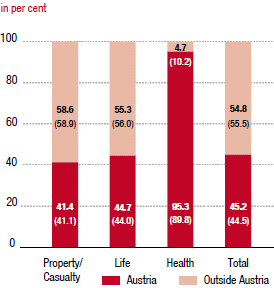
Percentage of premiums by region 2014
|


