Investments, shareholders’ equity and underwriting provisions
Investments
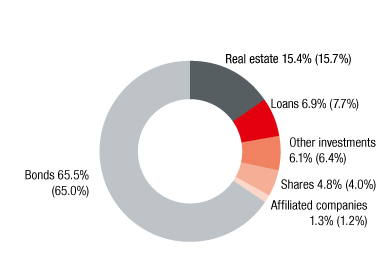
Breakdown of investments 2017

2016 values in parentheses
A brief presentation of the investments is included on page 134 of the notes to the consolidated financial statements.
Vienna Insurance Group’s total investments (including cash and cash equivalents) rose due to increased investing activities and positive capital market developments to EUR 37,430.6 million as of 31 December 2017, representing a year-on-year increase of 1,194.4 or 3.3%.
The investments include all VIG land and buildings, all shares in at equity consolidated companies and all financial instruments, using the look-through approach for consoli dated institutional funds, as well as other fund investments allocated to the asset classes.
Investments for unit-linked and index-linked life insurance are not included. These rose by 6.0% from EUR 8,549.6 million in 2016 to EUR 9,061.1 million in 2017, mainly due to positive market trends for unit- and index-linked products.
Shareholders’ equity
Vienna Insurance Group’s capital base increased by 5.8% to EUR 6,043.9 million in 2017 (2016: EUR 5,711.3 million). This change was mainly due to the profit for 2017 less dividend payments and positive currency effects (EUR 60.2 million).
Underwriting provisions
Underwriting provisions (excluding underwriting provisions for unit-linked and index-linked life insurance) were EUR 30,168.2 million as of 31 December 2017, representing an increase of 3.2% in comparison with the previous year (2016: EUR 29,220.1 million).
Composition |
31.12.2017 |
31.12.2016 |
Guaranteed policy benefits |
20,296,586 |
19,791,408 |
Allocated and committed profit shares |
754,879 |
808,622 |
Deferred mathematical reserve |
911,167 |
928,866 |
Total |
21,962,632 |
21,528,896 |
Development |
31.12.2017 |
31.12.2016 |
Book value as of 31.12. of the previous year |
21,528,896 |
21,068,385 |
Exchange rate differences |
108,888 |
-283 |
Book value as of 1.1. |
21,637,784 |
21,068,102 |
Additions |
2,313,871 |
1,821,155 |
Amount used/released |
-2,049,883 |
-1,402,363 |
Transfer from provisions for premium refunds |
44,150 |
42,198 |
Changes in scope of consolidation |
16,710 |
-196 |
Book value as of 31.12. |
21,962,632 |
21,528,896 |
Maturity structure |
31.12.2017 |
31.12.2016 |
up to one year |
1,666,442 |
1,621,431 |
more than one year up to five years |
5,907,616 |
5,909,867 |
more than five years up to ten years |
4,422,063 |
4,491,253 |
more than ten years |
9,966,511 |
9,506,345 |
Total |
21,962,632 |
21,528,896 |
Development |
31.12.2017 |
31.12.2016 |
Book value as of 31.12. of the previous year |
4,815,063 |
4,603,648 |
Exchange rate differences |
45,628 |
-23,908 |
Book value as of 1.1. |
4,860,691 |
4,579,740 |
Changes in scope of consolidation |
879 |
60,989 |
Allocation of provisions for outstanding claims |
5,081,147 |
3,196,819 |
for claims paid occurred in the reporting period |
3,869,180 |
2,528,806 |
for claims paid occurred in previous periods |
1,211,967 |
668,013 |
Use/release of provision |
-4,801,317 |
-3,022,485 |
for claims paid occurred in the reporting period |
-2,314,824 |
-1,457,007 |
for claims paid occurred in previous periods |
-2,486,493 |
-1,565,478 |
Book value as of 31.12. |
5,141,400 |
4,815,063 |
Maturity structure |
31.12.2017 |
31.12.2016 |
up to one year |
2,473,952 |
2,318,508 |
more than one year up to five years |
1,713,687 |
1,527,780 |
more than five years up to ten years |
438,093 |
435,623 |
more than ten years |
515,668 |
533,152 |
Total |
5,141,400 |
4,815,063 |