Bulgaria
Bulgarian insurance market
The top 5 insurance groups generated around 58% of market premiums in the 1st to 3rd quarter of 2017.
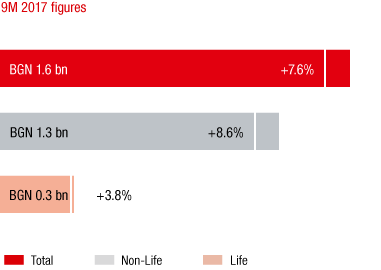
Market growth in the 1st to 3rd quarter of 2017 compared to the previous year

Source: Bulgarian Financial Supervision Commission (FSC)
The Bulgarian insurance market grew 7.6% in local currency terms in the first nine months of 2017. Premiums generated in the non-life sector increased 8.6% compared to the same period in the previous year. Around 70% of the premium volume in the non-life sector was generated in the motor lines of business, which also recorded high rates of growth in 2017 (motor third party liability +8.7%, motor own damage insurance +9.5%). The non-motor lines of business also grew strongly at 7.5%. The non-motor retail business and SME segment offer the greatest growth opportunities in the Bulgarian insurance market.
Most of the Bulgarian population has too little disposable income to invest in long-term savings products. Life insurance nevertheless recorded a premium increase of 3.8% in local currency terms.
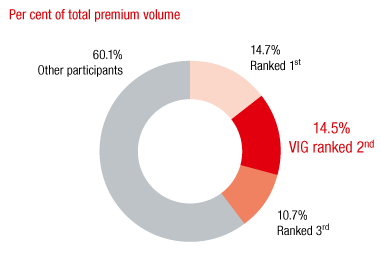
Market shares of the major insurance groups

Source: Bulgarian Financial Supervision Commission (FSC); as of 9M 2017
The average per capita expenditure for life insurance in Bulgaria was EUR 31 in 2016. Almost four times as much, EUR 116, was spent on non-life insurance. This corresponds to a total per capita premium of EUR 147 per year for insurance services.
VIG companies in Bulgaria
Vienna Insurance Group is represented in Bulgaria by the Group companies, Bulstrad Life, Bulstrad Non-Life and Nova.
Vienna Insurance Group’s market share of 14.5% puts it in second place in the Bulgarian insurance market. Vienna Insurance Group is in second place in the non-life sector, and is positioned as number one in life insurance. The largest pension fund, Doverie, also belongs to the Group.
Business development in Bulgaria in 2017
Premium development
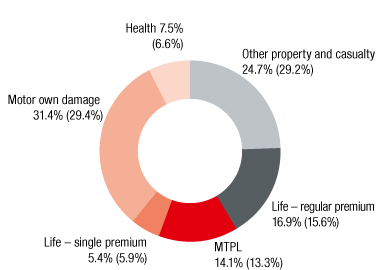
Premiums by line of business

Values for 2016 in parentheses
Premiums written in Bulgaria increased to EUR 150.1 million in 2017 (2016: EUR 136.7 million). The sharp increase of 9.8% was primarily due to good performance in the motor lines of business and regular premium life insurance. Net earned premiums were EUR 109.6 million in 2017, 13.6% higher than the previous year.
Expenses for claims and insurance benefits
The Bulgarian VIG companies had EUR 64.4 million in expenses for claims and insurance benefits (less reinsurance) in 2017 (2016: EUR 59.3 million). Due to a decrease in large losses the increase of 8.7% in insurance payments was significantly lower than the increase in net premiums (+13.6%).
Acquisition and administrative expenses
Acquisition and administrative expenses were EUR 38.8 million in 2017 (2016: EUR 32.0 million). The increase of 21.1% compared to the previous year was due to significantly higher commission expenses, which in turn was due to the increase in premiums and the elimination of almost commission-free large customer business.
Result before taxes
The Bulgarian Vienna Insurance Group companies, incl. the Doverie pension fund, contributed EUR 6.9 million to the total Group profit in 2017 (2016: EUR 5.4 million). Improvement in the combined ratio played a key role in this significant increase of 28.5%.
Combined Ratio
The combined ratio improved compared to the previous year to 97.1% due to a decrease in large losses (2016: 98.2%).
in EUR millions |
2017 |
2016 |
2015 |
2014 |
Premiums written |
150.1 |
136.7 |
131.1 |
114.4 |
Motor own damage insurance (Casco) |
47.1 |
40.2 |
35.7 |
30.2 |
Motor third party liability insurance |
21.2 |
18.2 |
24.1 |
21.8 |
Other property and casualty insurance |
37.1 |
39.9 |
37.2 |
34.6 |
Life insurance – regular premium |
25.3 |
21.3 |
20.8 |
19.9 |
Life insurance – single premium |
8.2 |
8.1 |
6.7 |
7.9 |
Health insurance |
11.3 |
9.0 |
6.6 |
0.0 |
Result before taxes |
6.9 |
5.4 |
-2.4 |
2.1 |