Slovakia
Slovakian insurance market
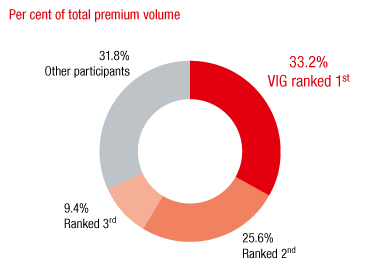
The top 5 insurance groups generated around 79% of the premium volume in the first three quarters of 2017. The two largest insurance groups generated around 59%.
Market growth in the 1st to 3rd quarter of 2017 compared to the previous year

Source: Slovak Insurance Association
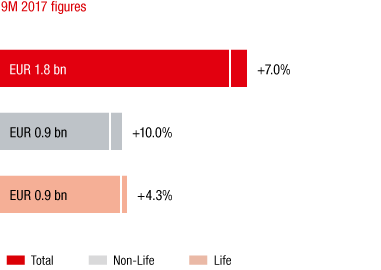
The Slovakian insurance market grew 7.0% in the 1st to 3rd quarter of 2017. Both the non-life and life sectors recorded a positive development.
The non-life market grew 10.0%. The large increase was partly due to the expansion of the 8% tax levy on all non-life insurance products sold as of 1 January 2017. Motor third party liability insurance was the only line of business affected by the tax levy prior to 2017, recorded a 9.6% increase. The remaining motor lines of business rose by 10.7%. The Slovakian Ministry of Finance is currently preparing an amendment of the law. The existing model will be replaced by a tax levy of which the amount varies depending on the line of business.
Following a decrease in the previous year, life insurance grew 4.3% in the first three quarters of 2017. This makes Slovakia an exception in Central and Eastern Europe, as the average per capita expenditure on life insurance exceeds that of non-life insurance. Insurance density was EUR 218 in the life sector and EUR 195 in the non-life sector in 2016. Total insurance expenditures averaged EUR 413 per capita in Slovakia.
VIG companies in Slovakia
Market shares of the major insurance groups

Source: Slovak Insurance Association; as of 9M 2017
VIG was represented by three insurance companies in Slovakia in 2017: Kooperativa, Komunálna and the life insurance company PSLSP, which specialises in bank distribution.
VIG’s market share of 33.2% makes it the leading insurance group in Slovakia. It holds second place in the non-life market and is the market leader in life insurance.
PSLSP will be merged with Kooperativa as of 1 April 2018. This step will promote the non-life business sales via the banks.
Business development in Slovakia in 2017
Premium development
Premiums by line of business

Values for 2016 in parentheses
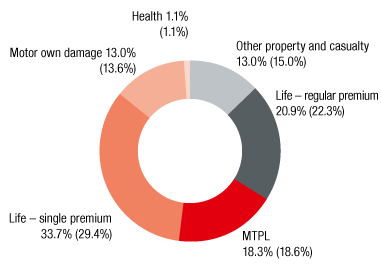
The Slovakian companies of Vienna Insurance Group wrote EUR 810.0 million in premiums written in 2017 (2016: EUR 732.3 million). This corresponds to a significant year-on-year increase of 10.6% that is primarily due to good growth in the life insurance lines of business. Net earned premiums were EUR 679.3 million, representing an increase of 13.6%.
Expenses for claims and insurance benefits
Expenses for claims and insurance benefits (less reinsurance) were EUR 558.0 million in 2017. This year-on-year increase of 13.5% was mainly due to the large increase in single premium life insurance, which led to higher provisions.
Acquisition and administrative expenses
VIG recorded EUR 107.4 million in acquisition and administrative expenses in Slovakia in 2017 (2016: EUR 100.4 million). The increase of 6.9% essentially corresponds to the increase in regular premiums.
Result before taxes
The Slovakian companies generated a result before taxes of EUR 55.7 million in 2017. This corresponds to a year-on-year increase of 14.0%, which was due to the increase in the life insurance underwriting result.
Combined Ratio
The combined ratio of the Slovakian VIG Group companies was an excellent 95.4% in 2017 (2016: 94.9%).
in EUR millions |
2017 |
2016 |
2015 |
2014 |
Premiums written |
810.0 |
732.3 |
716.5 |
727.0 |
Motor own damage insurance (Casco) |
105.2 |
99.5 |
90.1 |
88.0 |
Motor third party liability insurance |
148.1 |
136.5 |
131.1 |
132.1 |
Other property and casualty insurance |
105.1 |
109.8 |
109.1 |
104.9 |
Life insurance – regular premium |
169.6 |
163.2 |
160.2 |
157.2 |
Life insurance – single premium |
272.7 |
215.0 |
219.4 |
238.7 |
Health insurance |
9.4 |
8.4 |
6.7 |
6.1 |
Result before taxes |
55.7 |
48.9 |
51.9 |
59.5 |