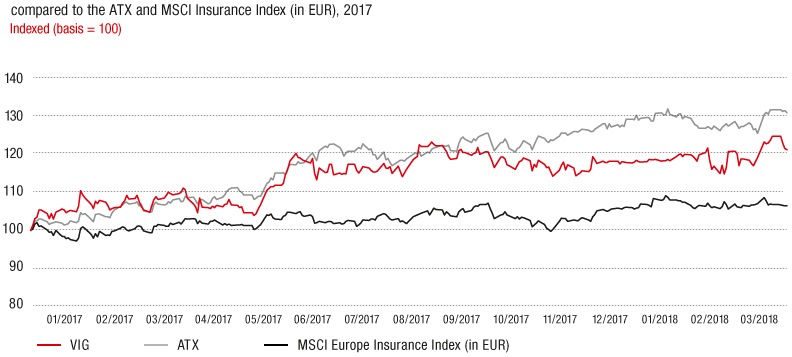
VIG shares with encourging gains in 2017
After a two-year dry spell, Vienna Insurance Group shares recorded a strong 21% gain in 2017, and significantly outperformed the major insurance indices.
2017 was a good year for both international stock markets and the Austrian ATX index. High corporate earnings, a favourable economy and the ongoing low level of interest rates sent share prices soaring. VIG shares also recorded a good start to the year, at times even outperforming the ATX index in the first quarter. Starting from a low for the year of EUR 21.590 on 2 January, the share price closed significantly above EUR 23 a number of times in March. VIG presented its Agenda 2020 programme to the capital markets for the first time when publishing its preliminary 2016 results at the end of March. It also reported on the planned development and expansion of its cooperation with Erste Group which had started in 2008.
Price rally in the 2nd quarter
An unprecedented price rally took place after publication of the final results on 19 April, which also included the solvency ratio of 195% at that time. VIG’s share price climbed to an interim high of EUR 25.560 at the beginning of May and then moved sideways in a narrow range between around EUR 24 and EUR 25 until the end of the 2nd quarter. It was not until the beginning of July that VIG shares once again temporarily outperformed the ATX and exceeded the threshold of EUR 26 for the first time on 6 July. The share price lost ground again in the 3rd quarter, drifting lower to EUR 24.330 in the middle of September. VIG shares returned to the price range above EUR 25 at the beginning of the 4th quarter of 2017.
Mergers and acquisitions
After a calm period in October and November, when the mergers of Group companies in Slovakia and Austria were announced, prices started to show more fluctuation again in December. The merger of two companies in the Czech Republic and purchase of Seesam Insurance in the Baltic states were announced during this period. VIG shares reached their high for the year of EUR 26.520 on 22 December, and finally closed 2017 at a price of EUR 25.765. After two years of double-digit price losses, the price increase of 21.0% underscores the return of investor confidence. Although the spread between VIG shares and the ATX index, which reached 30.6% in 2017, still existed, Vienna Insurance Group clearly outperformed the two insurance indices, Euro Stoxx 600 Insurance (+6.9%) and MSCI Europe Insurance Index (+6.4%).
SHARE PERFORMANCE – VIENNA INSURANCE GROUP (VIG)

Key share information |
|
2017 |
2016 |
2015 |
2014 |
||||
|
|||||||||
Market capitalisation |
EUR million |
3,297.92 |
2,726.40 |
3,237.12 |
4,746.24 |
||||
Average number of shares traded per day |
Piece |
~ 104,000 |
~ 161,000 |
~ 147,000 |
~ 65,000 |
||||
Average daily stock exchange trading volume (single counting) |
EUR million |
3.0 |
3.9 |
6.8 |
3.1 |
||||
Year-end price |
EUR |
25.765 |
21.300 |
25.290 |
37.080 |
||||
High |
EUR |
26.520 |
24.790 |
42.620 |
40.070 |
||||
Low |
EUR |
21.590 |
16.095 |
24.910 |
33.800 |
||||
Share performance for the year (excluding dividends) |
% |
20.96 |
-15.80 |
-31.80 |
2.36 |
||||
Dividend per share |
EUR |
0.901 |
0.80 |
0.60 |
1.4 |
||||
Dividend yield |
% |
3.49 |
3.76 |
2.37 |
3.78 |
||||
Earnings per share2 |
EUR |
2.23 |
2.16 |
-0.27 |
2.46 |
||||
Price-earnings ratio as of 31 December |
|
11.55 |
9.86 |
-93.67 |
15.07 |
||||