Key figures at a glance
|
|
|
2017 |
2016 |
2015 |
2014 |
||||||||
|
|||||||||||||
|
Income statement |
|
|
|
|
|
||||||||
|
Premiums written |
EUR millions |
9,386.0 |
9,051.0 |
9,019.8 |
9,145.7 |
||||||||
|
Net earned premiums – retention |
EUR millions |
8,509.6 |
8,191.3 |
8,180.5 |
8,353.7 |
||||||||
|
Financial result |
EUR millions |
924.3 |
958.8 |
1,040.2 |
1,076.5 |
||||||||
|
Expenses for claims and insurance benefits |
EUR millions |
-6,872.6 |
-6,753.4 |
-6,748.9 |
-6,919.9 |
||||||||
|
Acquisition and administrative expenses |
EUR millions |
-2,040.3 |
-1,907.8 |
-1,847.6 |
-1,874.8 |
||||||||
|
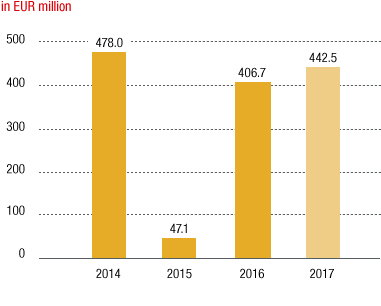
Result before taxes |
EUR millions |
442.5 |
406.7 |
47.1 |
478.0 |
||||||||
|
Net result for the period after taxes and non-controlling interest |
EUR millions |
297.6 |
287.8 |
-20.6 |
330.4 |
||||||||
|
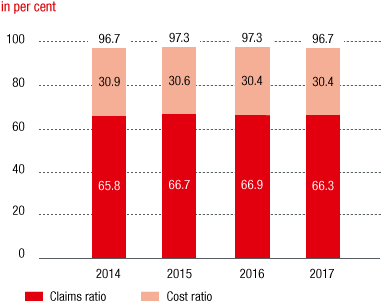
Combined Ratio |
% |
96.7 |
97.3 |
97.3 |
96.7 |
||||||||
|
Claims ratio |
% |
66.3 |
66.9 |
66.7 |
65.8 |
||||||||
|
Cost ratio |
% |
30.4 |
30.4 |
30.6 |
30.9 |
||||||||
|
Balance sheet |
|
|
|
|
|
||||||||
|
Investments1 |
EUR millions |
44,994.0 |
43,195.8 |
38,286.1 |
38,002.2 |
||||||||
|
Shareholders’ equity (including non-controlling interests) |
EUR millions |
6,043.9 |
5,711.3 |
4,414.5 |
4,796.3 |
||||||||
|
Underwriting provisions |
EUR millions |
38,780.9 |
37,350.0 |
35,921.7 |
35,282.4 |
||||||||
|
Total assets |
EUR millions |
51,714.0 |
50,008.1 |
44,489.7 |
43,923.1 |
||||||||
|
Return on Equity (RoE)2 |
% |
8.3 |
8.9 |
1.1 |
11.1 |
||||||||
|
Share |
|
|
|
|
|
||||||||
|
Number of shares |
Piece |
128,000,000 |
128,000,000 |
128,000,000 |
128,000,000 |
||||||||
|
Market capitalisation |
EUR millions |
3,297.9 |
2,726.4 |
3,237.1 |
4,746.2 |
||||||||
|
Average number of shares traded by day |
Piece |
~ 104,000 |
~ 161,000 |
~ 147,000 |
~ 65,000 |
||||||||
|
Average daily stock exchange trading volume (single counting) |
EUR millions |
3.0 |
3.9 |
6.8 |
3.1 |
||||||||
|
Year-end price |
EUR |
25.765 |
21.300 |
25.290 |
37.080 |
||||||||
|
High |
EUR |
26.520 |
24.790 |
42.620 |
40.070 |
||||||||
|
Low |
EUR |
21.590 |
16.095 |
24.910 |
33.800 |
||||||||
|
Share performance for the year (excluding dividends) |
% |
20.96 |
-15.80 |
-31.80 |
2.36 |
||||||||
|
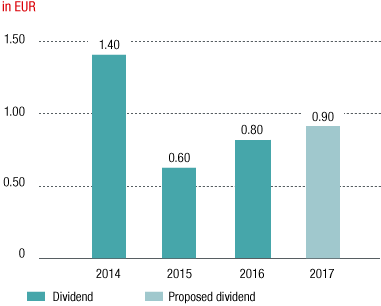
Dividend per share |
EUR |
0.903 |
0.80 |
0.60 |
1.40 |
||||||||
|
Dividend yield |
% |
3.49 |
3.76 |
2.37 |
3.78 |
||||||||
|
Earnings per share |
EUR |
2.23 |
2.16 |
-0.27 |
2.46 |
||||||||
|
Price-earnings ratio as of 31 December |
|
11.55 |
9.86 |
-93.67 |
15.07 |
||||||||
|
Employees |
|
|
|
|
|
||||||||
|
Number of employees (average for the year) |
|
25,059 |
24,601 |
22,995 |
23,360 |
||||||||
CHANGE IN PROFIT

CHANGE IN THE COMBINED RATIO

|
Country |
Premium volume |
Result before taxes |
Combined Ratio |
Employees |
||||
|
|
in EUR ‘000 |
in EUR ‘000 |
in % |
Number |
||||
|
||||||||
|
Austria |
3,848,496 |
175,349 |
95.5 |
5,141 |
||||
|
Czech Republic |
1,603,246 |
149,345 |
97.5 |
4,895 |
||||
|
Slovakia |
810,049 |
55,708 |
95.4 |
1,752 |
||||
|
Poland |
886,646 |
35,502 |
93.9 |
1,576 |
||||
|
Romania |
506,544 |
6,178 |
98.6 |
1,954 |
||||
|
Baltic states |
327,607 |
1,394 |
99.0 |
1,285 |
||||
|
Hungary |
246,741 |
2,112 |
98.9 |
468 |
||||
|
Bulgaria |
150,106 |
6,916 |
97.1 |
867 |
||||
|
Turkey/Georgia |
207,784 |
9,352 |
96.1 |
1,081 |
||||
|
Remaining CEE1 |
351,997 |
-5,954 |
100.1 |
4,741 |
||||
|
Other Markets2 |
292,611 |
23,690 |
81.3 |
130 |
||||
DIVIDEND PER SHARE

DIVIDEND PER SHARE

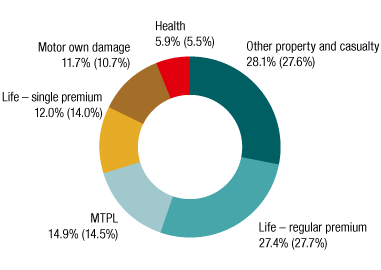
Values for 2016 in parentheses