Key figures at a glance
|
|
2016 |
2015 adjusted |
2014 adjusted |
||||||
|
||||||||||
Income statement |
|
|
|
|
||||||
Premiums written |
EUR millions |
9,050.97 |
9,019.76 |
9,145.73 |
||||||
Net earned premiums – retention |
EUR millions |
8,191.26 |
8,180.54 |
8,353.74 |
||||||
Financial result |
EUR millions |
958.81 |
1,040.20 |
1,076.48 |
||||||
Expenses for claims and insurance benefits |
EUR millions |
-6,753.45 |
-6,748.87 |
-6,919.93 |
||||||
Acquisition and administrative expenses |
EUR millions |
-1,907.81 |
-1,847.57 |
-1,874.77 |
||||||
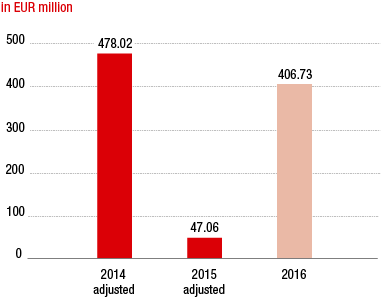
Result before taxes |
EUR millions |
406.73 |
47.06 |
478.02 |
||||||
Net result for the period after taxes and non-controlling interest |
EUR millions |
287.78 |
-20.58 |
330.42 |
||||||
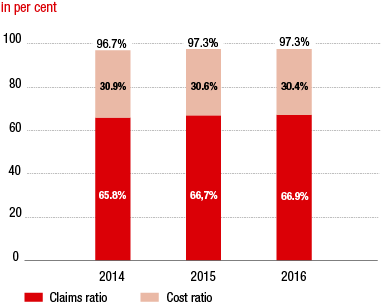
Combined Ratio |
% |
97.3 |
97.3 |
96.7 |
||||||
Claims ratio |
% |
66.9 |
66.7 |
65.8 |
||||||
Cost ratio |
% |
30.4 |
30.6 |
30.9 |
||||||
Balance sheet |
|
|
|
|
||||||
Investments1 |
EUR millions |
43,195.84 |
38,286.10 |
38,002.20 |
||||||
Shareholders’ equity (excluding non-controlling interests) |
EUR millions |
5,711.26 |
4,414.46 |
4,796.33 |
||||||
Underwriting provisions |
EUR millions |
37,349.96 |
35,921.73 |
35,282.37 |
||||||
Total assets |
EUR millions |
50,008.11 |
44,489.71 |
43,923.13 |
||||||
RoE (Return on Equity) |
% |
8.9 |
1.1 |
11.1 |
||||||
Share |
|
|
|
|
||||||
Number of shares |
Piece |
128,000,000 |
128,000,000 |
128,000,000 |
||||||
Market capitalisation |
EUR millions |
2,726.40 |
3,237.12 |
4,746.24 |
||||||
Average number of shares traded by day |
Piece |
~ 161,000 |
~ 147,000 |
~ 65,000 |
||||||
Average daily stock exchange trading volume (single counting) |
EUR millions |
3.90 |
6.80 |
3.10 |
||||||
Year-end price |
EUR |
21.300 |
25.290 |
37.080 |
||||||
High |
EUR |
24.790 |
42.620 |
40.070 |
||||||
Low |
EUR |
16.095 |
24.910 |
33.800 |
||||||
Share performance for the year (excluding dividends) |
% |
-15.80 |
-31.80 |
2.36 |
||||||
Dividend per share |
EUR |
0.802 |
0.60 |
1.40 |
||||||
Dividend yield |
% |
3.76 |
2.37 |
3.78 |
||||||
Earnings per share |
EUR |
2.16 |
-0.27 |
2.46 |
||||||
Price-earnings ratio as of 31 December |
|
9.86 |
-93.67 |
15.07 |
||||||
Employees |
|
|
|
|
||||||
Number of employees (average for the year) |
|
24,601 |
22,995 |
23,360 |
||||||
CHANGE IN PROFIT

CHANGE IN THE COMBINED RATIO

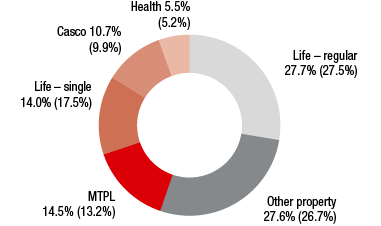
PREMIUMS BY LINES OF BUSINESS

Values for 2015 in parentheses
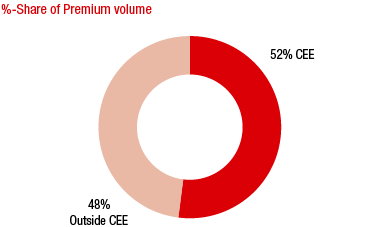
CEE SHARE OF PREMIUM VOLUME

