Investments, shareholders’ equity and underwriting provisions
Investments
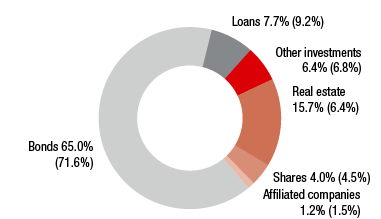
Breakdown of Investments 2016

2015 values in parentheses
A brief presentation of the investments is included on page 151 of the notes to the consolidated financial statements.
Total VIG investments (including cash and cash equivalents) were EUR 36,236.20 million as of 31 December 2016. Compared with the previous year, this represents an increase of EUR 4,993.02 million, or 16.0%. The main reason for the increase was the change in consolidation method used for the non-profit societies, which resulted in all of their assets and liabilities being included in the consolidated financial statements.
The investments include all Vienna Insurance Group land and buildings, all shares in at equity consolidated companies and all financial instruments, using the look-through approach for consolidated institutional funds, as well as other fund investments allocated to the asset classes. Investments for unit-linked and index-linked life insurance are not included. These rose 5.0% from EUR 8,144.14 million in 2015 to EUR 8,549.58 million in 2016, mainly due to price gains for fund-linked and index-linked products.
Shareholders’ equity
Vienna Insurance Group’s capital base increased by 29.4% to EUR 5,711.26 million in 2016 (2015: EUR 4,414.46 million). This change was primarily due to the change in consolidation method used for the non-profit societies, which raised shareholders’ equity by EUR 1,006.17 million, and to the result for the period of EUR 320.99 million.
Underwriting provisions
Underwriting provisions (excluding underwriting provisions for unit-linked and index-linked life insurance) were EUR 29,220.07 million as of 31 December 2016, representing an increase of 3.8% over the previous year (2015: EUR 28,145.12 million).
in EUR '000 |
31.12.2016 |
31.12.2015 |
Guaranteed policy benefits |
19,791,408 |
19,304,414 |
Allocated and committed profit shares |
808,622 |
932,810 |
Deferred mathematical reserve |
928,866 |
831,161 |
Total |
21,528,896 |
21,068,385 |
in EUR '000 |
31.12.2016 |
31.12.2015 |
Book value as of 31.12. of the previous year |
21,068,385 |
20,854,835 |
Exchange rate changes |
-283 |
47,969 |
Book value as of 1.1. |
21,068,102 |
20,902,804 |
Additions |
1,821,155 |
1,755,960 |
Amount used/released |
-1,402,363 |
-1,645,491 |
Transfer from provisions for premium refunds |
42,198 |
55,112 |
Changes in scope of consolidation |
-196 |
0 |
Book value as of 31.12. |
21,528,896 |
21,068,385 |
in EUR '000 |
31.12.2016 |
31.12.2015 |
up to one year |
1,621,431 |
1,880,715 |
more than one year up to five years |
5,909,867 |
5,628,947 |
more than five years up to ten years |
4,491,253 |
4,427,303 |
more than ten years |
9,506,345 |
9,131,420 |
Total |
21,528,896 |
21,068,385 |
in EUR '000 |
31.12.2016 |
31.12.2015 |
Book value as of 31.12. of the previous year |
4,603,648 |
4,493,370 |
Exchange rate changes |
-23,908 |
3,596 |
Book value as of 1.1. |
4,579,740 |
4,496,966 |
Changes in scope of consolidation |
60,989 |
7,401 |
Allocation of provisions for outstanding claims |
3,196,819 |
3,354,228 |
for claims occurred in the reporting period |
2,528,806 |
2,894,726 |
for claims occurred in previous periods |
668,013 |
459,502 |
Usage/release of provision |
-3,022,485 |
-3,254,947 |
for claims occurred in the reporting period |
-1,457,007 |
-1,590,660 |
for claims occurred in previous periods |
-1,565,478 |
-1,664,287 |
Book value as of 31.12. |
4,815,063 |
4,603,648 |
in EUR '000 |
31.12.2016 |
31.12.2015 |
up to one year |
2,318,508 |
2,093,215 |
more than one year up to five years |
1,527,780 |
1,499,433 |
more than five years up to ten years |
435,623 |
495,659 |
more than ten years |
533,152 |
515,341 |
Total |
4,815,063 |
4,603,648 |
