Key figures VIG share
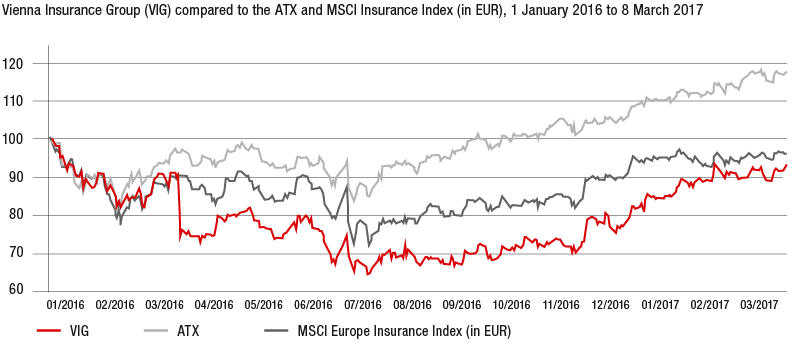
SHARE PERFORMANCE – VIENNA INSURANCE GROUP (VIG)

|
|
2016 |
2015 |
2014 |
||||
|
||||||||
Market capitalisation |
EUR million |
2,726.40 |
3,237.12 |
4,746.24 |
||||
Average number of shares traded per day |
Shares |
approx. 161,000 |
approx. 147,000 |
approx. 65,000 |
||||
Average daily stock exchange trading volume (single counting) |
EUR million |
3.9 |
6.8 |
3.1 |
||||
Year-end price |
EUR |
21.300 |
25.290 |
37.080 |
||||
High |
EUR |
24.790 |
42.620 |
40.070 |
||||
Low |
EUR |
16.095 |
24.910 |
33.800 |
||||
Share performance for the year (excluding dividends) |
% |
-15.80 |
-31.80 |
2.36 |
||||
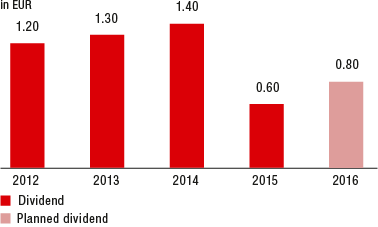
Dividend per share |
EUR |
0.801) |
0.60 |
1.40 |
||||
Dividend yield |
% |
3.76 |
2.37 |
3.78 |
||||
Earnings per share2) |
EUR |
2.16 |
-0.27 |
2.46 |
||||
Price-earnings ratio as of 31 December |
|
9.86 |
-93.67 |
15.07 |
||||
|
|
Initial listing (Vienna) |
17 October 1994 |
Initial listing (Prague) |
5 February 2008 |
Number of common shares |
128 million |
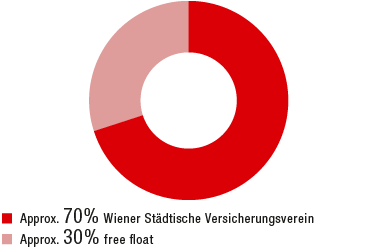
Free float |
approx. 30% |
ISIN |
AT0000908504 |
Security symbol |
VIG |
Bloomberg |
VIG AV / VIG CP |
Reuters |
VIGR.VI / VIGR.PR |
Standard & Poor’s rating |
A+, stable outlook |
|
|
||
|
|||
Record date AGM |
2 May 2017 |
||
Annual General Meeting |
12 May 2017 |
||
Ex-dividend day |
17 May 2017 |
||
Record date |
18 May 2017 |
||
Dividend payment day |
19 May 2017 |
||
Results for the 1st quarter of 2016 |
23 May 2017 |
||
Results for the 1st half of 2016 |
22 August 2017 |
||
Results for the 1st to 3rd quarters of 2016 |
29 November 2017 |
||
SHAREHOLDER STRUCTURE

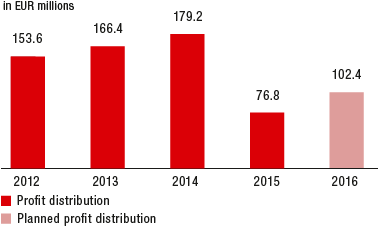
PROFIT DISTRIBUTIONS

DIVIDEND PER SHARE

